
My Fitness Journey
I was in good shape when I was younger. Like many of us, by my mid-40s, my career, family, and the stresses of life took their toll. I got slow and squishy. I happened so slowly I never perceived it. It was a decades-in-the-making slow, insidious slide into a sedentary lifestyle with a diet rich in simple carbs and fast food. A health scare at 44 got my attention and gave me the convictions I needed to get healthy. I gradually started making important changes to my diet. I cut out the sugar and the bad carbs and lost 25 lbs. I started hiking – mostly because I just hated going to the gym. Surprisingly, hiking became therapy for me. Within a few years, I found myself hiking hundreds of miles a year. I even hiked the John Muir Trail and climbed the Cotopaxi Volcano in Ecuador. I found a hobby that keeps me fit, and everything else flows from that. I find joy in my hobby, so I work hard at it, do it with other people, and keep score so I can improve. And it pays huge dividends in every other area of my life. What’s your hobby? What could it be? What’s stopping you?
How I Train
In this season of my life, I’m not training to look better in a t-shirt. At my age, I can’t get motivated by that. I’m training to DO things. And what I want to do is climb steep elevation with weight, scrambling on Class 2, 3, 4, and 5 terrain at high altitude. I’ve got a real job, so I’ve got to be smart about where I put my limited time and energy. Here is my routine…
- Aerobic Base – I spend time in ~80% of my time maintaining my aerobic base. This involves staying in heart rate Zones 1 and 2 and carrying a weighted pack up steep terrain. When I can’t get outside, I use a stepmill at the gym.
- Intensity – I spend ~10% of my training doing high-intensity interval training (HIIT). This maintains a high VO2 Max, which complements my aerobic base. As we age, our VO2 Max declines rapidly – unless we continue to train at intensity. Joe Friel’s research makes a compelling case for not abandoning intensity as I age, and I follow his advice as best I can. Twice a month, I do a HIIT session on the stepmill, 5 minutes low intensity, 5 minutes max intensity for 4 rounds.
- Strength – I spend ~10% of my time on strength training, mostly bodyweight (pull-ups, push-ups, dips, single-leg squats, and ab work). If I am winning at my strength routine, it shows up in my body composition when I get a DEXA scan – typically every 6-8 weeks.
Here is a typical week for me. As you can see, it’s not that complicated. Think of me as the “Triumph of the Average.” Nearly anyone can do this, or something like this, only tailored to their own sport.
| Monday | Tuesday | Wednesday | Thursday | Friday | Saturday | Sunday |
| HIIT Training (1 hr) | Strength Training (30 min) | Very Early Morning Fitness Hike (4 hrs) | Recovery | Hike (Twice a month) | Strength Training (30 min) |
What I Measure
I can only improve what I measure, so I take measurement seriously. Most of my data comes from a chest strap heart monitor I wear with my Garmin Fenix watch. This ensures I get accurate data. My Garmin data imports automatically into TrainingPeaks, where I can do more detailed analysis. I track peaks on Peakbagger, and I track my body composition at BodyMetRX in Redlands, using a DEXA scan. Here are the stats I track annually…
Aerobic Base Stats
| Total Ascents | NEW Ascents | Elevation Gain/Loss | Backcountry Mileage | Total Fitness Hours | Training Stress (TSS) | Average Weekly TSS | |
| 2025 | 98 | 2 | 183,470 | 587 | 411 | 16871 | 324 |
| 2024 | 70 | 22 | 181,515 | 628 | 425 | 18889 | 363 |
| 2023 | 52 | 14 | 119,594 | 393 | 358 | 16475 | 317 |
| 2022 | 18 | 8 | 84,200 | 245 | 259 | 12766 | 246 |
| 2021 | 39 | 13 | 127,005 | 529 | 405 | 18616 | 358 |
| 2020 | 23 | 12 | 109,526 | 422 | |||
| 2019 | 12 | 5 | 49,930 | 125 | |||
| 2018 | 38 | 27 | 132,250 | 412 | |||
| 2017 | 17 | 6 | 67,380 | 202 | |||
| 2016 | 26 | 7 | 111,980 | 338 | |||
| 2015 | 6 | 5 | 24,280 | 67 | |||
| Total | 399 | 121 | 1,191,130 | 3948 | 1858 | 83617 |
- Total Ascents – Total number of named peaks climbed during the year.
- New Ascents – Total number of new peaks climbed during the year.
- Elevation Gain/Loss – Total elevation gain from all hiking activities during the year.
- Backcountry Mileage – Total backcountry mileage from all hiking activities.
- Fitness Hours – Total amount of recorded fitness hours captured by Garmin Connect.
- Training Stress (hrTSS) – The Heart Rate Training Stress Score in TrainingPeaks measures the physiological stress of a workout using your heart rate data. One hour spent at your lactate threshold heart rate equals 100 points. It estimates training load based on time spent in heart rate zones.
- Average Weekly TSS – Total TSS divided by 52 weeks.
Intensity Stats
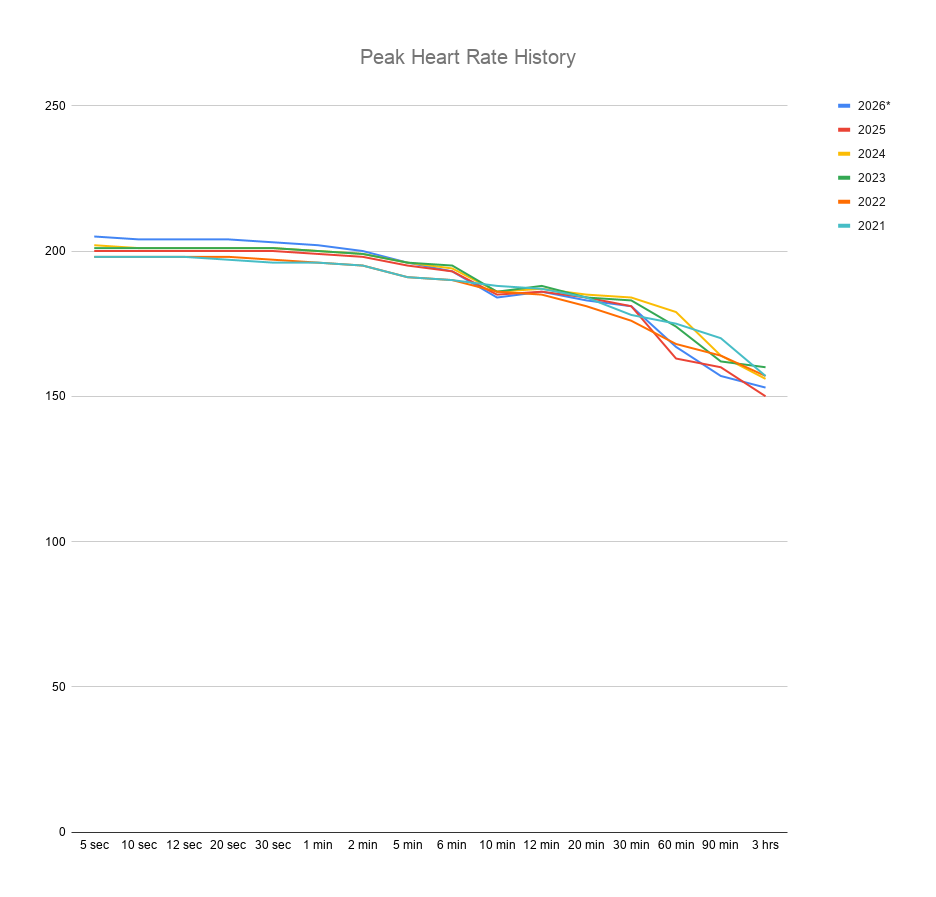
| 2026* | 2025 | 2024 | 2023 | 2022 | 2021 | |
| 5 sec | 205 | 200 | 202 | 201 | 198 | 198 |
| 10 sec | 204 | 200 | 201 | 201 | 198 | 198 |
| 12 sec | 204 | 200 | 201 | 201 | 198 | 198 |
| 20 sec | 204 | 200 | 201 | 201 | 198 | 197 |
| 30 sec | 203 | 200 | 201 | 201 | 197 | 196 |
| 1 min | 202 | 199 | 200 | 200 | 196 | 196 |
| 2 min | 200 | 198 | 199 | 199 | 195 | 195 |
| 5 min | 196 | 195 | 196 | 196 | 191 | 191 |
| 6 min | 193 | 193 | 194 | 195 | 190 | 190 |
| 10 min | 184 | 185 | 186 | 186 | 186 | 188 |
| 12 min | 186 | 186 | 187 | 188 | 185 | 187 |
| 20 min | 183 | 184 | 185 | 184 | 181 | 184 |
| 30 min | 181 | 181 | 184 | 183 | 176 | 178 |
| 60 min | 167 | 163 | 179 | 174 | 168 | 175 |
| 90 min | 157 | 160 | 164 | 162 | 164 | 170 |
| 3 hrs | 153 | 150 | 156 | 160 | 157 | 157 |
Body Composition Stats
| 7/20/26 | 6/26/26 | 11/10/25 | 2/15/25 | 12/16/24 | 8/20/24 | 5/8/24 | 2/5/24 | 11/20/23 | 9/5/23 | 5/31/23 | 3/1/23 | 11/21/22 | 8/31/22 | 5/25/22 | 11/19/21 | |
| Weight (lbs) | 179.3 | 181.9 | 185 | 181.7 | 182.5 | 176.7 | 179.3 | 177.1 | 171.5 | 175.9 | 179.3 | 176.9 | 177.1 | 176.8 | 176.8 | 183.2 |
| Muscle Mass (lbs) | 67.3 | 70.6 | 70.7 | 66.5 | 67.2 | 68.2 | 71 | 68.5 | 66 | 67 | 68.4 | 67.5 | 68 | 69.1 | 68.2 | 70.1 |
| Fat Mass (lbs) | 34.3 | 32.8 | 36.7 | 40.6 | 38.2 | 31.3 | 28.5 | 31 | 30.8 | 32.6 | 34.2 | 31.4 | 31.4 | 28 | 33.5 | 35.4 |
| Body Fat Percentage | 19.13% | 18.03% | 19.84% | 22.34% | 20.93% | 17.71% | 15.90% | 17.50% | 17.96% | 18.53% | 19.07% | 17.75% | 17.73% | 15.84% | 18.95% | 19.32% |
My Benchmark Workouts
Effort and work capacity are two different ideas. Measuring heart rate-based data is useful, but the point of cardiovascular fitness is to do work more efficiently. In other words, it’s not about how high I can get my heart rate; it’s about how low I can keep it while doing more work than I did the time before. Doing benchmark workouts over time answer this question. To this end, I do two benchmark workouts: A loop to the summit of Mount Baldy that gains ~4,000′ in ~8 miles, and another workout near my home that I call the 5 Peaks Traverse. The traverse gains and loses ~2,000 feet in ~4.5 miles. In addition to these workouts, I also track max reps of pull-ups, push-ups, and dips as a baseline for the efficacy of my strength program.